
A guest blog for Serenity Financial Planning by Alistair Meadows, Investment Analyst at EBI Portfolios
“You will always hate something in your portfolio. Really, really hate it”. James Osbourne (Bason Asset Management) October 2014.
We often get communications from advisers telling us that they have clients who have concerns with regard to one (or more) of their holdings in EBI Portfolios, which for whatever reason are doing badly at that point. What follows is an attempt to explain why the portfolio is diversified and how (and why) this methodology works.
Looking at the One Year chart for EBI 100 (Home Bias) it is not hard to spot the outlier; Global Property has lagged badly in the last year (and indeed over two years as well).
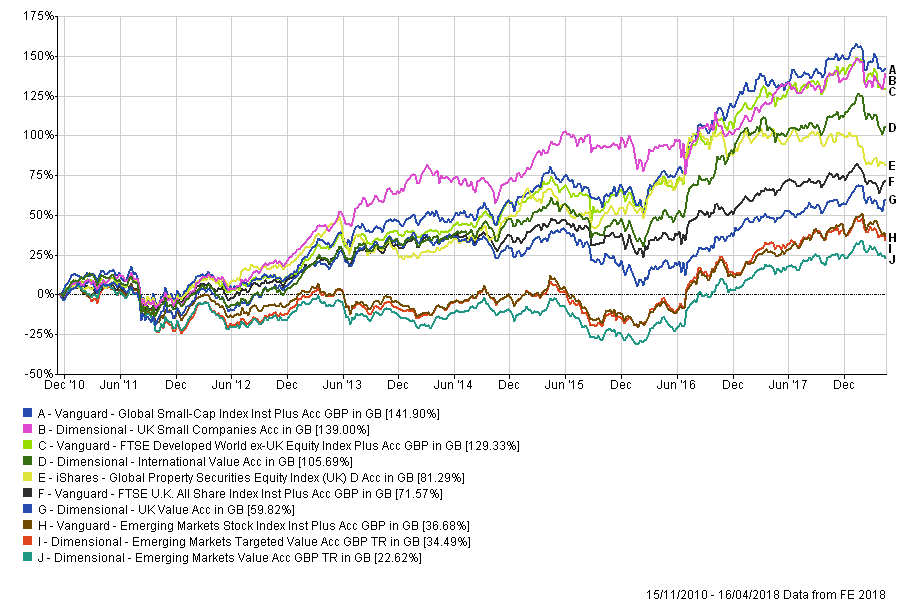
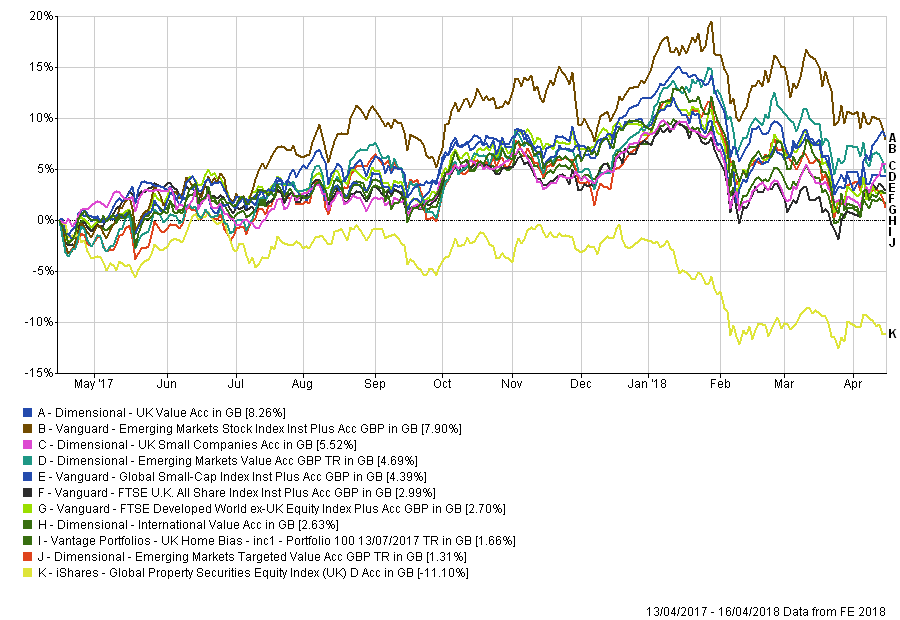 Over 10 years, however, the picture changes dramatically; over that time, Property is in the middle of the pack. The fund (and by extension, Global Property), has gone sideways since August 2016, partly as a result of the Brexit outcome, but not coincidentally, the 13th of July 2016 also marks the low in Global Bond yields (as per the Barclays Global Aggregate Bond Index); 10-year Gilt yields too reached a low point in August 2016 (at 0.52%). As of this week, UK Gilts now yield 1.49%, a two-fold increase, which has put pressure on Property prices (as they are valued relative to a Discount Rate that is now 200% higher).
Obviously, this has hurt performance (though maybe by not as much as one might imagine), but it has led to some pointed questions, so it might be a good idea to review why we have the holding and what its purpose is within the context of our portfolios. Here goes…
The main argument for Diversification, in general, is about risk reduction (however it is defined) and not about portfolio return, (which is where asset allocation comes in). Provided that the correlation between two assets is less than one, there is a diversification benefit to owning the second [1] and the lower the correlation between the two assets, the bigger the diversification benefit. It is based on the work of Harry Markowitz, whose work on Modern Portfolio Theory won him the Nobel Prize.
The idea is that if one asset declines there will be an offsetting rise in another (or at least a smaller fall); bonds, for example, tend to do better in economic declines compared to stocks, offsetting losses that occur in the value of the equity markets (recessions tend to see falling Corporate profits, whilst bonds benefit from the resulting Interest rate cuts). Thus, by increasing the number of (lowly or non-correlated) assets in a portfolio, one can reduce risk without sacrificing potential returns; thus the investor is diversifying away investment risk and in the process improving risk-adjusted returns.
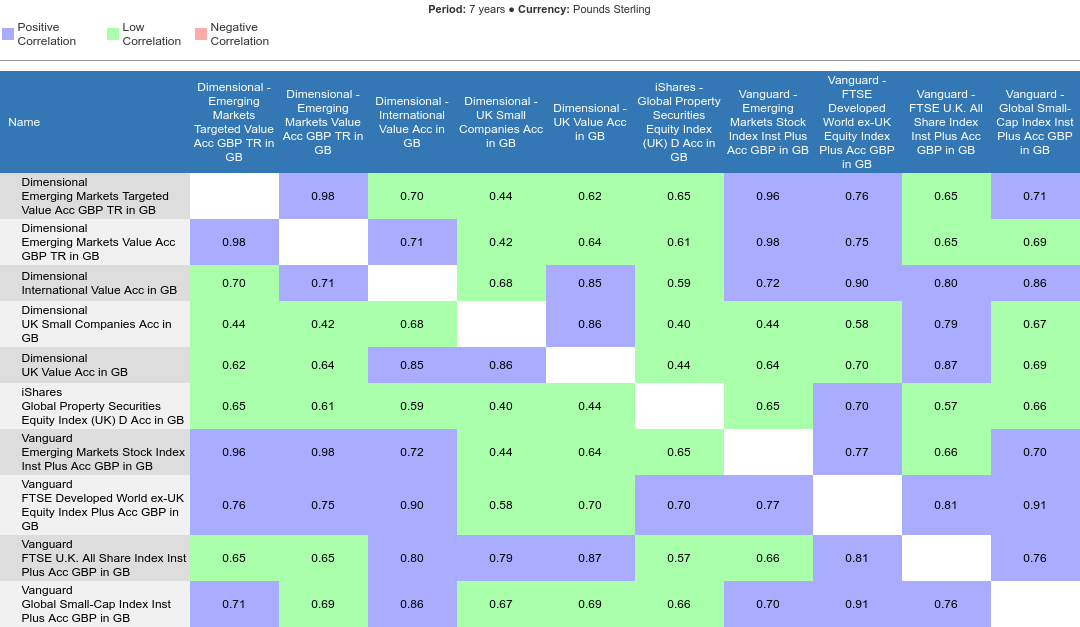
Returning to EBI 100, the 7-year correlation table below shows that the correlation between Global Property and the other constituents of the portfolio is between 0.4 and 0.7 over the last 7 years and according to FE is nearer to 0.3 between itself and some of the Shorter-dated bond funds (though data is not available for those that have been in existence for less than 7 years), providing a high degree of diversification. That the fund has not performed well is not a bug, but a feature of the investment process – not everything can rise simultaneously, even if the (false) lesson of 2017 implied the opposite.
So why do we diversify? Because not all investments perform well at the same time, as they are affected differently by the same events (inflation rises, exchange rate movements etc.) It enables the investor to build a portfolio where the combined risk of all the constituents is lower than that of the individual holdings. Diversification can be achieved by investing a large number of different stocks (provided as above that they have low correlations with each other), by Industry, by Region or by Asset class, as long as the different investments tend not to be affected in the same way by the same event. (If one were to invest exclusively in Banks, for example, one would be taking a big “bet” on the direction of interest rates).
Of course, over shorter time frames this may not “work”, but diversification would be unnecessary if we knew the future with complete certainty (and accuracy). Anything can (and often does) happen, and diversification alone will not allow an investor to avoid a bear market completely. It is also the case that correlations change over time, so a given move in one security vis-a-vis another will differ over different time periods. Another point to note is that in times of severe market stress, correlations between assets (particularly equities) tend to rise towards one, reducing the benefits of owning large numbers of different types of shares. But the principle still holds, especially when using equities AND bonds.
A well-structured portfolio needs to be designed with the client in mind, with special reference to risk tolerance; it is not sufficient to build one that the investor should have, but the one they will stick with. Too much (or too little) risk will cause emotional swings that tempts them to get in (or get out) at precisely the wrong time. It is not necessarily the plan that will fail, but the ability/willingness to follow it that will be the hurdle. Understanding the reasons for an asset’s inclusion in the portfolio and thus why at times it will not do so well is key to following the long-term plan. Once this is accepted, the re-balancing process (which of necessity involves buying those assets that have underperformed and selling those that have done well – a.k.a buying low and selling high) becomes second nature.
This article highlights the dilemma faced if one chooses to focus on only one part of the portfolio; interestingly it was posted 14 days before our first re-balance (buying Emerging Markets) whose performance the author laments. The success of the policy was demonstrated two years later, when EBI re-balanced again, but doing the opposite, as EM had breached the tolerance bands on the up-side this time. So, having the discipline to buy what others are selling, (see the comparison between this view, at the end of 2015 and the diametric opposite – after prices have risen – at the end of 2017), where EBI sold down our EM exposure, served us (and more importantly our Investors) well.
Diversification will always mean that one will do worse than the BEST asset class, but it’s not a competition, (except with oneself). The asset allocation at any given moment, therefore, is always (a bit) “wrong”, but we cannot know (or predict) what will happen in markets, so cannot avoid the “bad stuff”. The chart (here) shows no consistent pattern, precisely because there is none. If we bail out during bad times, we may not see the good times either.
[1] A correlation of 1 means that the two assets (be they stocks, bonds, currencies etc) move in exactly the same direction. A correlation of -1 means they move in exactly the opposite direction. Importantly this does not mean that the magnitude of the move will be proportionate, however.
The general “rule” that if you want to have a higher return you must increase risk is broadly true but incomplete; in order for that to be the case, the two alternative portfolios of assets must BOTH maximise expected return per unit of risk, or equivalently minimise risk per unit of return (i.e be on the “Efficient Frontier”. This chart illustrates the concept.
A simple example would be owning two stocks (e.g. one Oil company and one Airline). If we assume a correlation of 0.25 between them, ownership of the Oil company alone would lead to a 10% loss if the stock fell by that amount. If one owns an equal share of both, a 10% drop in the former would imply a 4% drop in the latter, leaving the 50:50 portfolio down (0.5 x 0.1) + (0.5 x 0.04) = -0.05+ -0.02= 0.07 or -7% for the portfolio.
If we diversify via a different asset class (e.g. bonds), we get an even better result. US Bonds tend to have a negative correlation with equities (currently around -0.3), so a 10% drop in oil stock, combined with an equal weighting in US Treasuries would imply a portfolio loss of (0.5 x 0.1) – (0.5 x 0.03) = -0.05+ 0.015 = -3.5%.
For those Advisers who wish to get into the subject in more depth, Vanguard has written a wealth of material, one of which is here.
About the Author
Alistair Meadows is a veteran of stock markets having started his career in the City of London during the heady days of the mid 1980s. After 10 years he moved into (active) fund management in 2000. He repented of his ways and joined EBI in 2014 and is now responsible for helping advisers and investors get the same flow of timely information and quality analysis that is available to professional investors. He qualified as a Chartered Financial Analyst in 2005, and refreshed his skills in 2015 by gaining the Investment Management Certificate. He can be contacted at alistair@ebip.co.uk.

